Twitter Code Snippets
Published:
140 character twitter code. 
140 character code
The other day, @BlasMBenito posted this on twitter. Using a support vector machine to do species distribution modelling. All in 140 characters.
library(kernlab)
m <- ksvm(formula, data=my.dataframe, kernel="laplacedot", kpar=list(sigma=1))
m.map <- predict(my.predictors, m)
I suggested a couple of edits to include the package information (kernlab and dismo) yielding this.
m <- kernlab::ksvm(formula, data=my.dataframe, kernel="laplacedot", kpar=list(sigma=1))
m.map <- dismo::predict(my.predictors, m)
I had done a bit of squishing fun code in 140 characters before. Here is a go at bootstrapping a regression p-value. This was on of the first things I posted on @statsforbios.
x<-1:25
y<-x+rnorm(25,0,15)
b<-ecdf(replicate(1000,lm(y~sample(x,25,T))$coef[2]))
p<-1-b(lm(y~x)$coef[2])
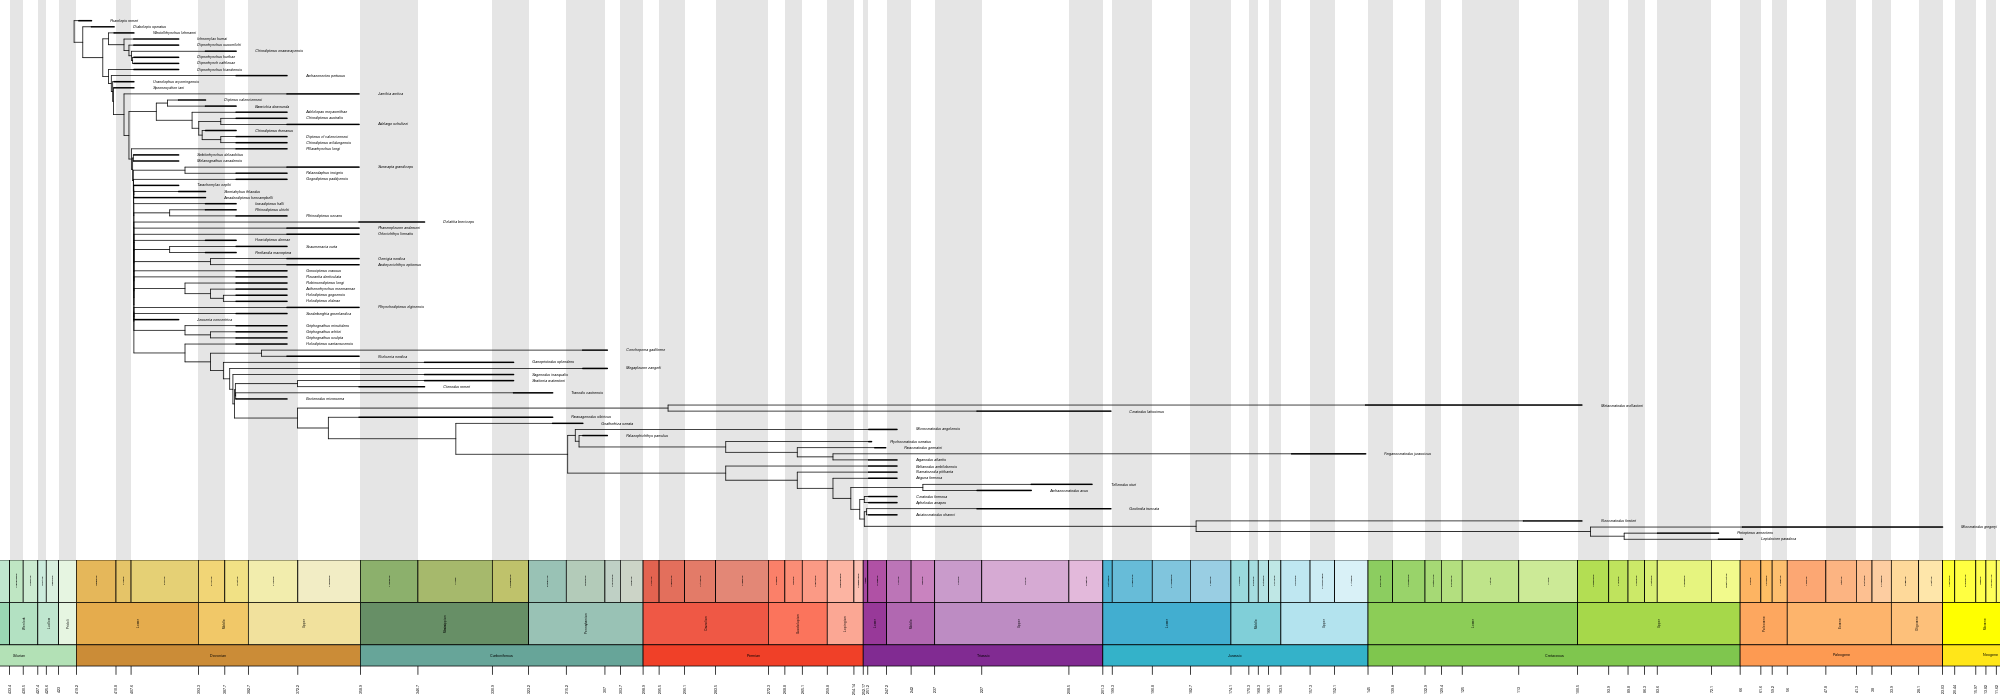
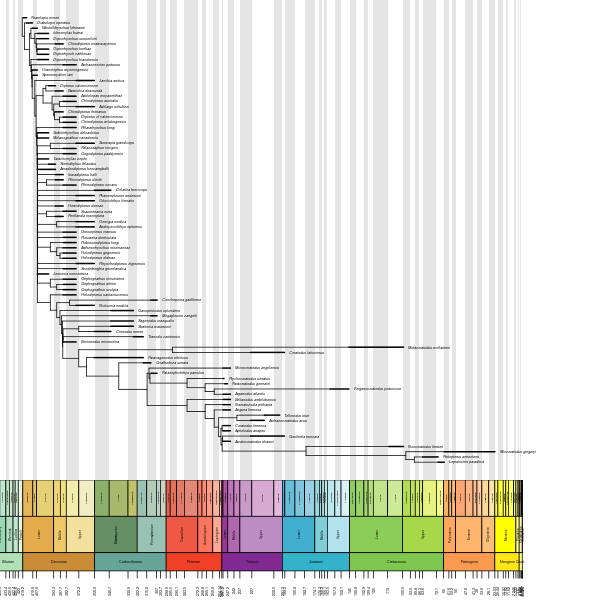
That same day, @GraemeTLloyd posted (in two tweets) some code that installs packages, and makes a very nice phylogeny with a straigraphic timeline. I did a bit of fiddling to get it into one tweet.
install.packages(c("strap","geoscale"))
library(strap)
d=Dipnoi
X=DatePhylo(d$tr,d$ag,1,"equal")
geoscalePhylo(X,d$ag,ranges=T,boxes="Age")
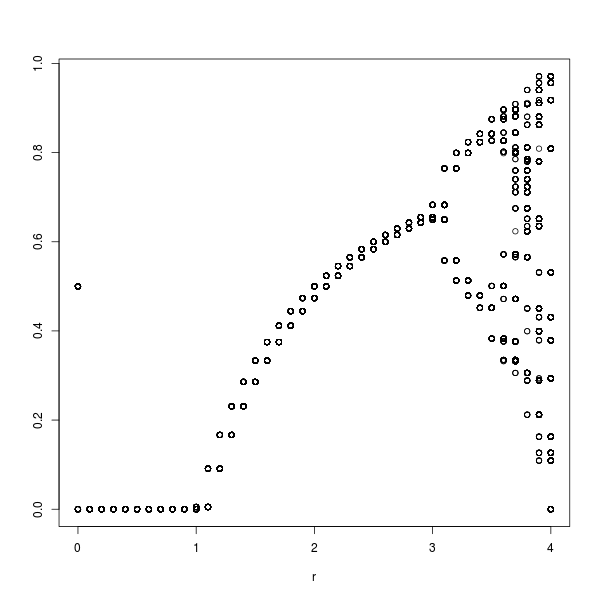
So, all these people doing good stuff in 140 characters prompted me to have another go. Unfortunately my brain was working quite poorly that day. I did manage to get the generation of a logistic map into 140 characters. But it is about the slowest, least efficient R code I have ever written. So, the output with these parameters is an incredibly course logistic map.
h=rep(0.5,200)
x=c()
for(r in seq(0,4,0.1)){
	for(n in 2:200){
		h[n]=r*h[n-1]*(1-h[n-1])
		x = rbind(x, cbind(r, h[190:200]))
	}
}
plot(x)
So there you are! Some fun stuff in 140 characters. I’ll have another go sometime. I think I did a neural network once. Who knows.
